
Constantly adding new features to the web app is a great way to enhance the product and add extra value to the users. But without paying attention to the overall performance of the web app the user experience might suffer as the web app becomes bulkier, slower and less accessible.
The same way developers pay attention to the code quality by writing and running tests, doing performance benchmark of the server side code and performing static code analysis, it is also possible to continuously audit various UI/UX performance aspects of the web app.
One way to do it is to use a tool called lighthouse by Google, which comes embedded in Google’s Chrome browser? You can access it by opening Chrome’s dev tools and navigating to the Audits tab.
](https://cdn-images-1.medium.com/max/4272/1*i4IROCxI9zjTcxkeQ-o3vw.png)
By continuously auditing the web app’s performance we can observe the trend of the performance and detect the downgrade sooner. In this post, I would like to show you how we can run the tests on a schedule base by writing a small node script and running it periodically on Azure DevOps Build pipeline.
Let’s start with the script
The source code is available on https://github.com/AndrejsAbrickis/lighthouse-azure-devops
/// <reference path="./node_modules/lighthouse/typings/externs.d.ts"/>
import * as fs from 'fs';
import * as chromeLauncher from 'chrome-launcher';
import lighthouse from 'lighthouse/lighthouse-core';
import ReportGenerator from 'lighthouse/lighthouse-core/report/report-generator';

const run = async (url: string, options: chromeLauncher.Options) => {
  const chrome: chromeLauncher.LaunchedChrome = await chromeLauncher.launch({ chromeFlags: options.chromeFlags });
  options.port = chrome.port;

  try {
    const results: LH.RunnerResult = await lighthouse(url, options);
    const jsonReport = ReportGenerator.generateReport(results.lhr, 'json');

    fs.writeFile('results.json', jsonReport, (err) => {
      if (err) {
        console.log(err);

        return;
      };

      console.log('Successfully Written to File: results.json');
    });
  } catch (error) {
    throw new Error(error);
  } finally {
    await chrome.kill();
  }
}

const urlToTest = 'https://www.abrickis.me/';

run(urlToTest, { chromeFlags: ['--headless'] });
Here’s what happens when we execute the run method.
First, the chrome-launcher starts a new instance of Google Chrome browser with the provided
chromeFlags(we are running Chrome in headless mode with--headlessflag) and stores the port number of the running Chrome instance in the options. L8-L9Next, we run the lighthouse audit by providing the URL to audit and options and store the audit results locally. Lighthouse is communicating with the browser through the port we stored in the previous step. L12
To generate a JSON report (alternative option is HTML) we have to use the ReportGenerator’s
generateReport()method and pass the lighthouse results object from the previous step and the output type. L13In this example, the output is written to the results.json file using node’s filesystem API -
fs. L15-L23And finally, we kill the chrome instance before exiting the script. L27
To view the results one can drag n’ drop the results.json or copy paste its content into Google Chrome’s lighthouse viewer on https://googlechrome.github.io/lighthouse/viewer/
Set up Azure DevOps build pipeline
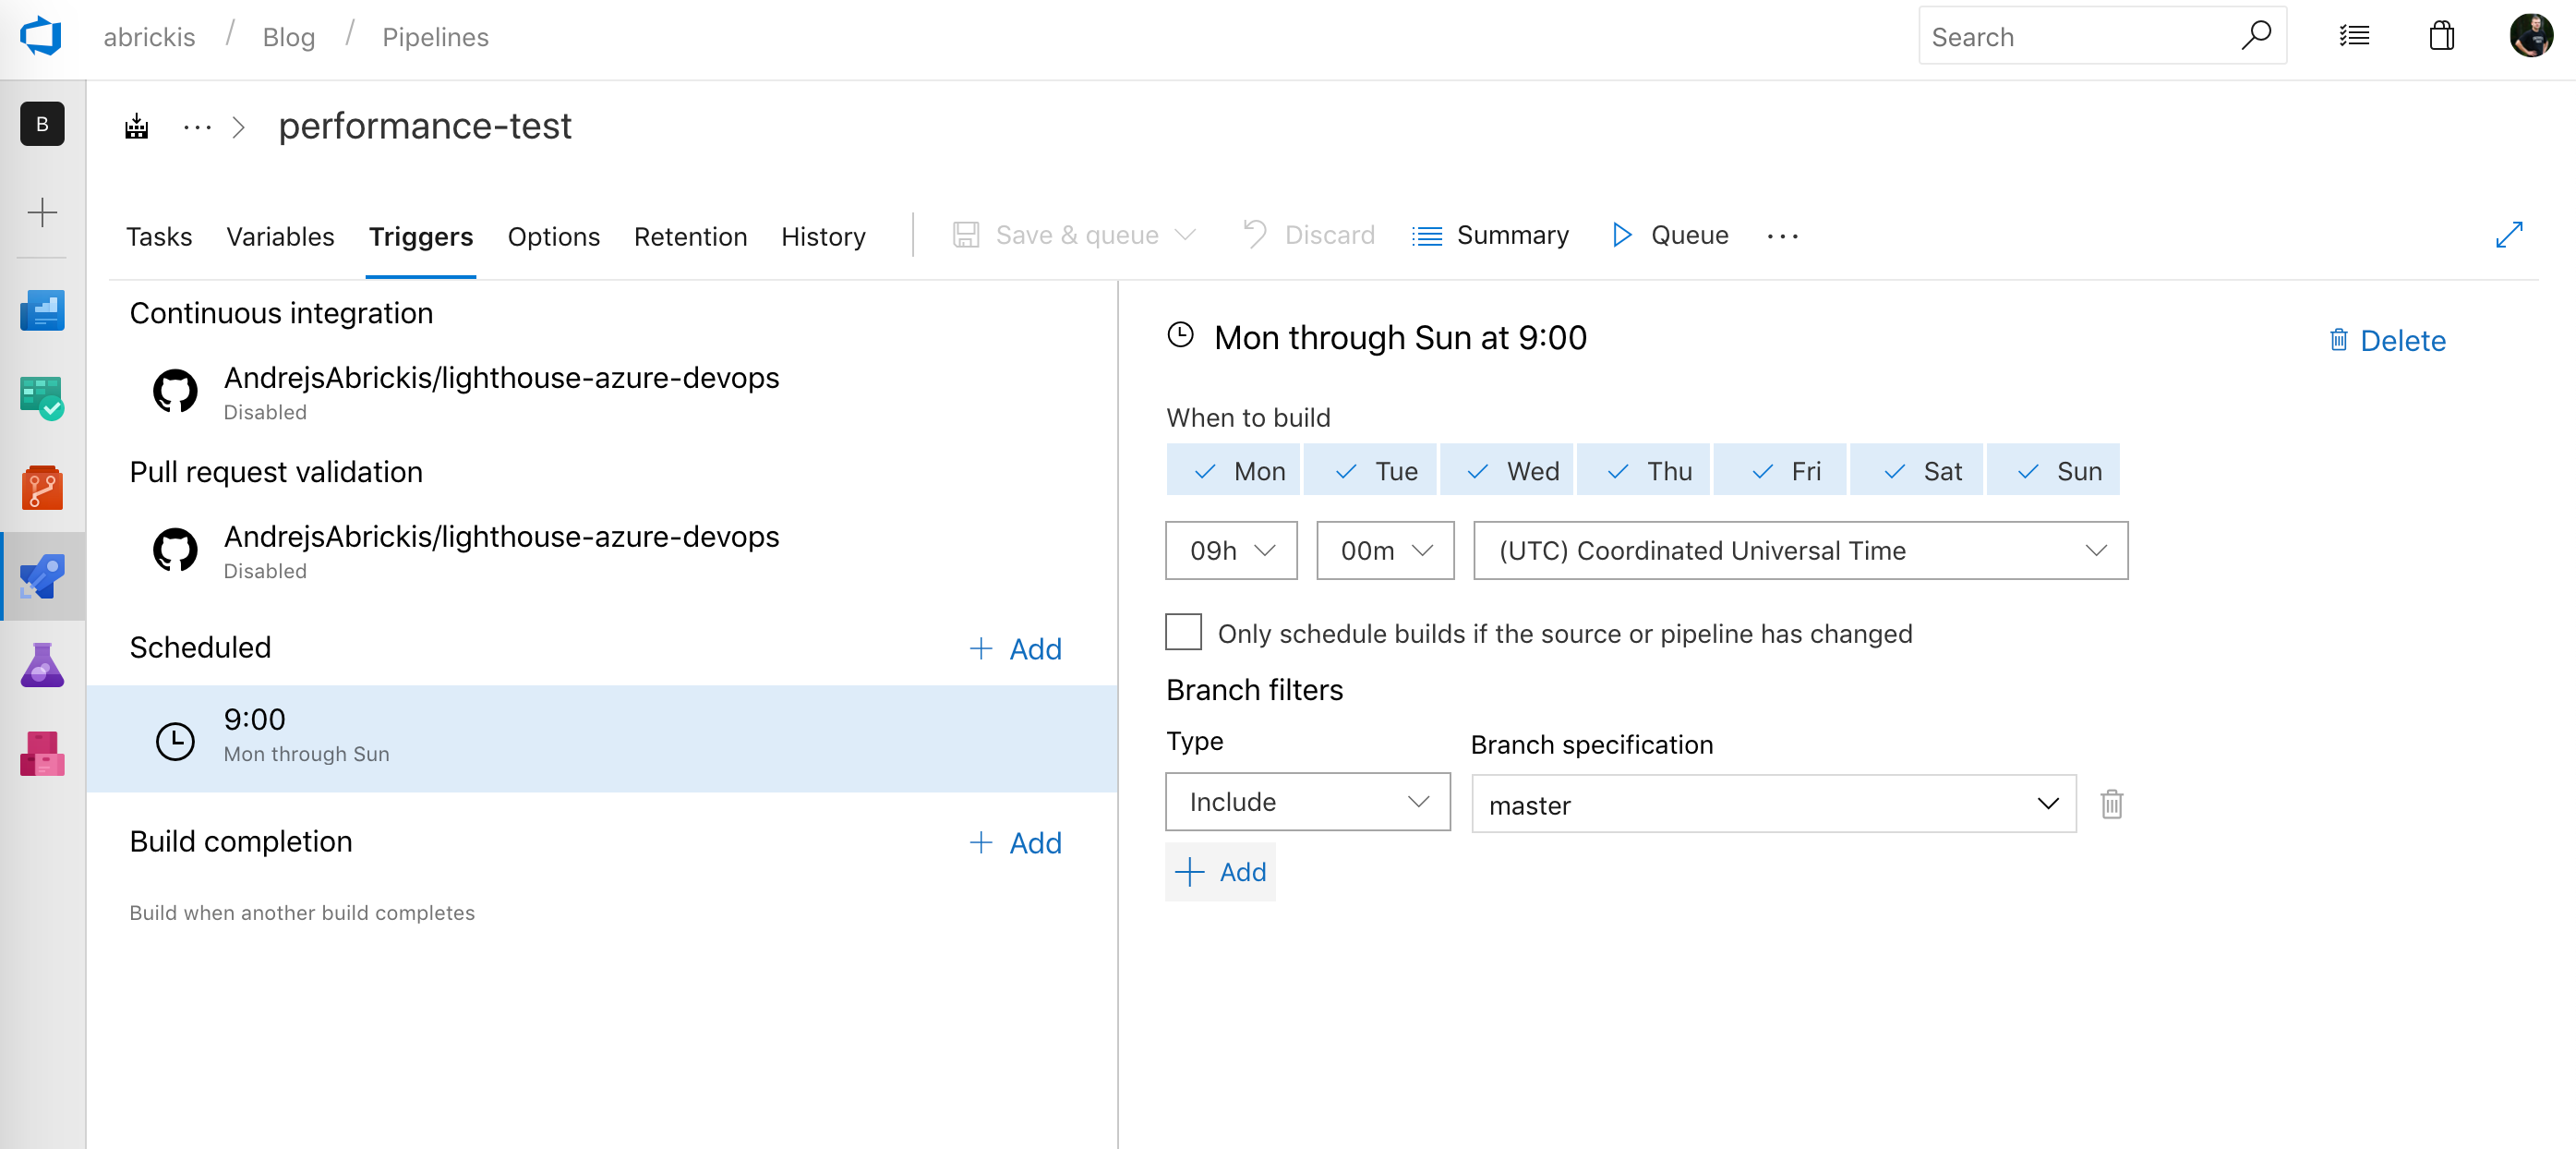
Next, we are going to set up a build pipeline and schedule the performance test to run every day on 9 AM. But one could also use this setup to create pre and post-deploy tasks in Release pipeline to measure the performance change before and after the release of production or any other release stage.
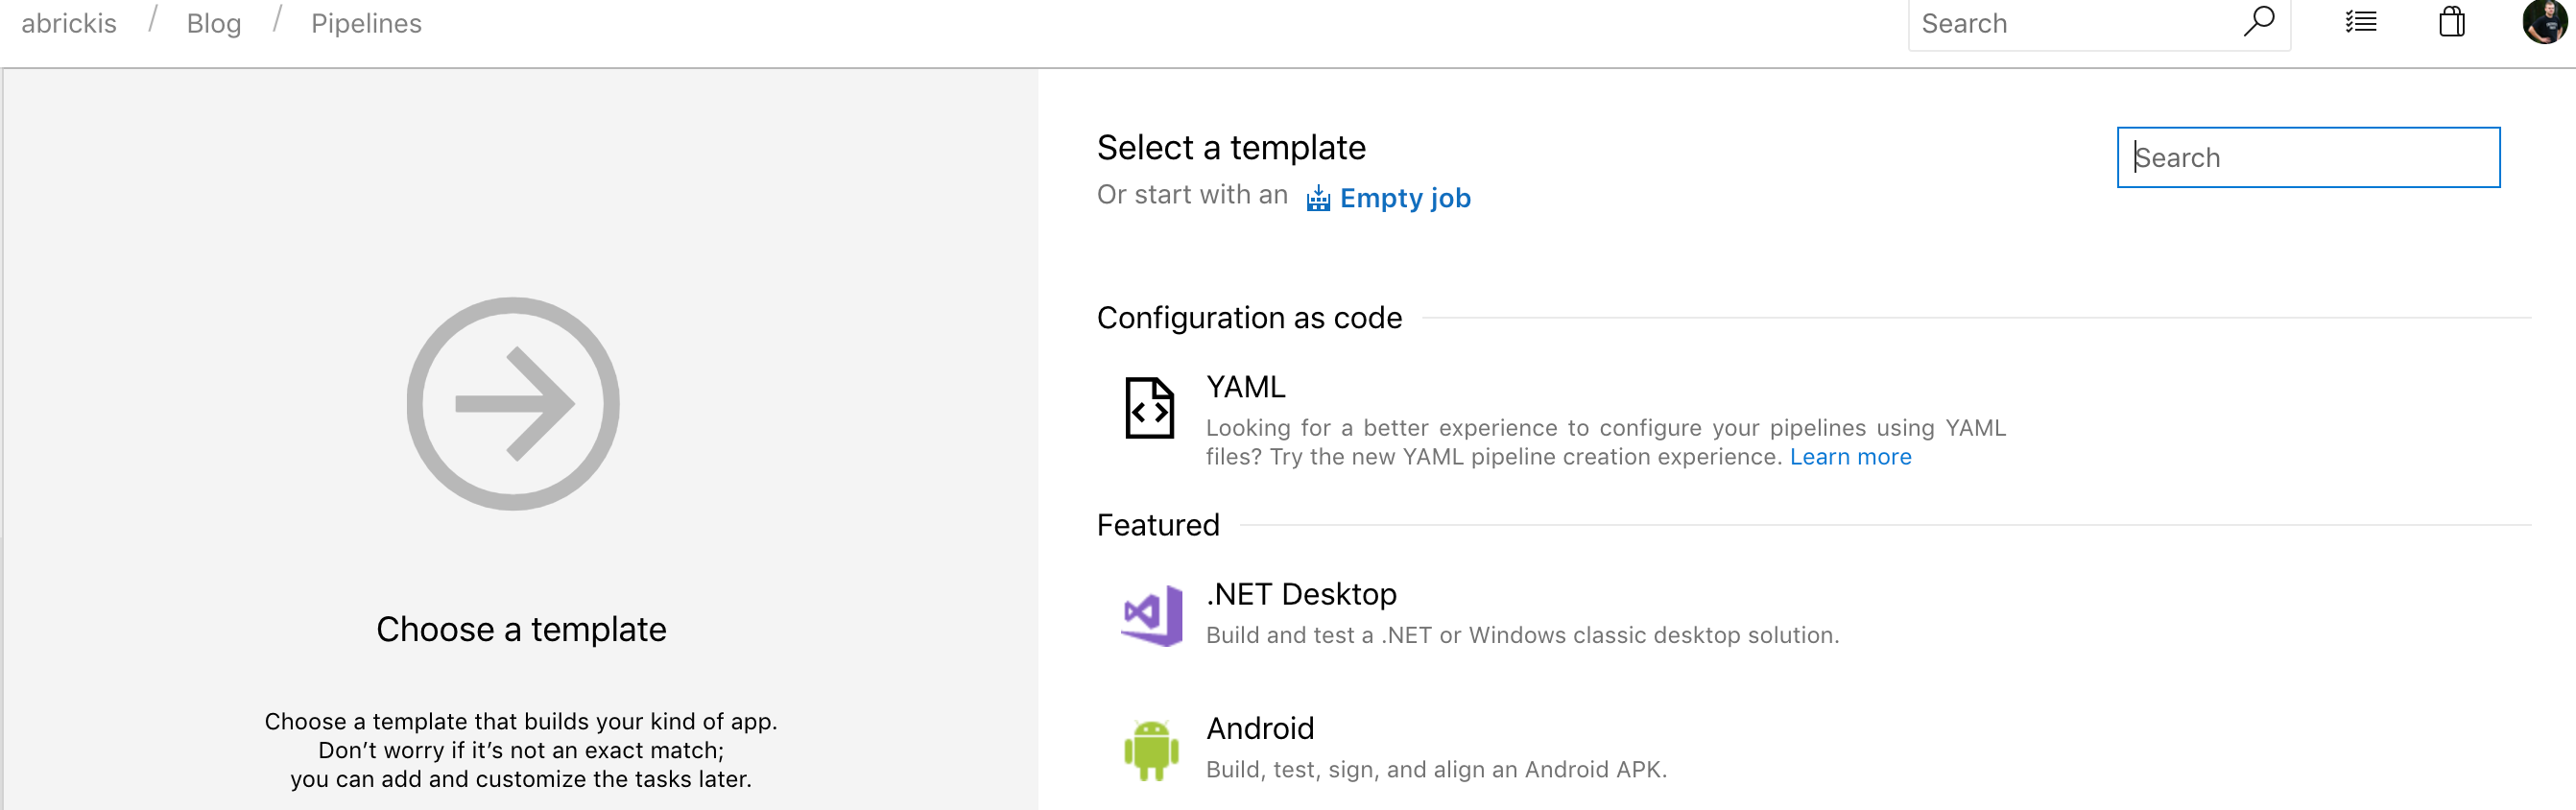
First, we are going to create a new, empty build pipeline. We are going to use a visual pipeline designed but one can also define the pipeline using yaml file.
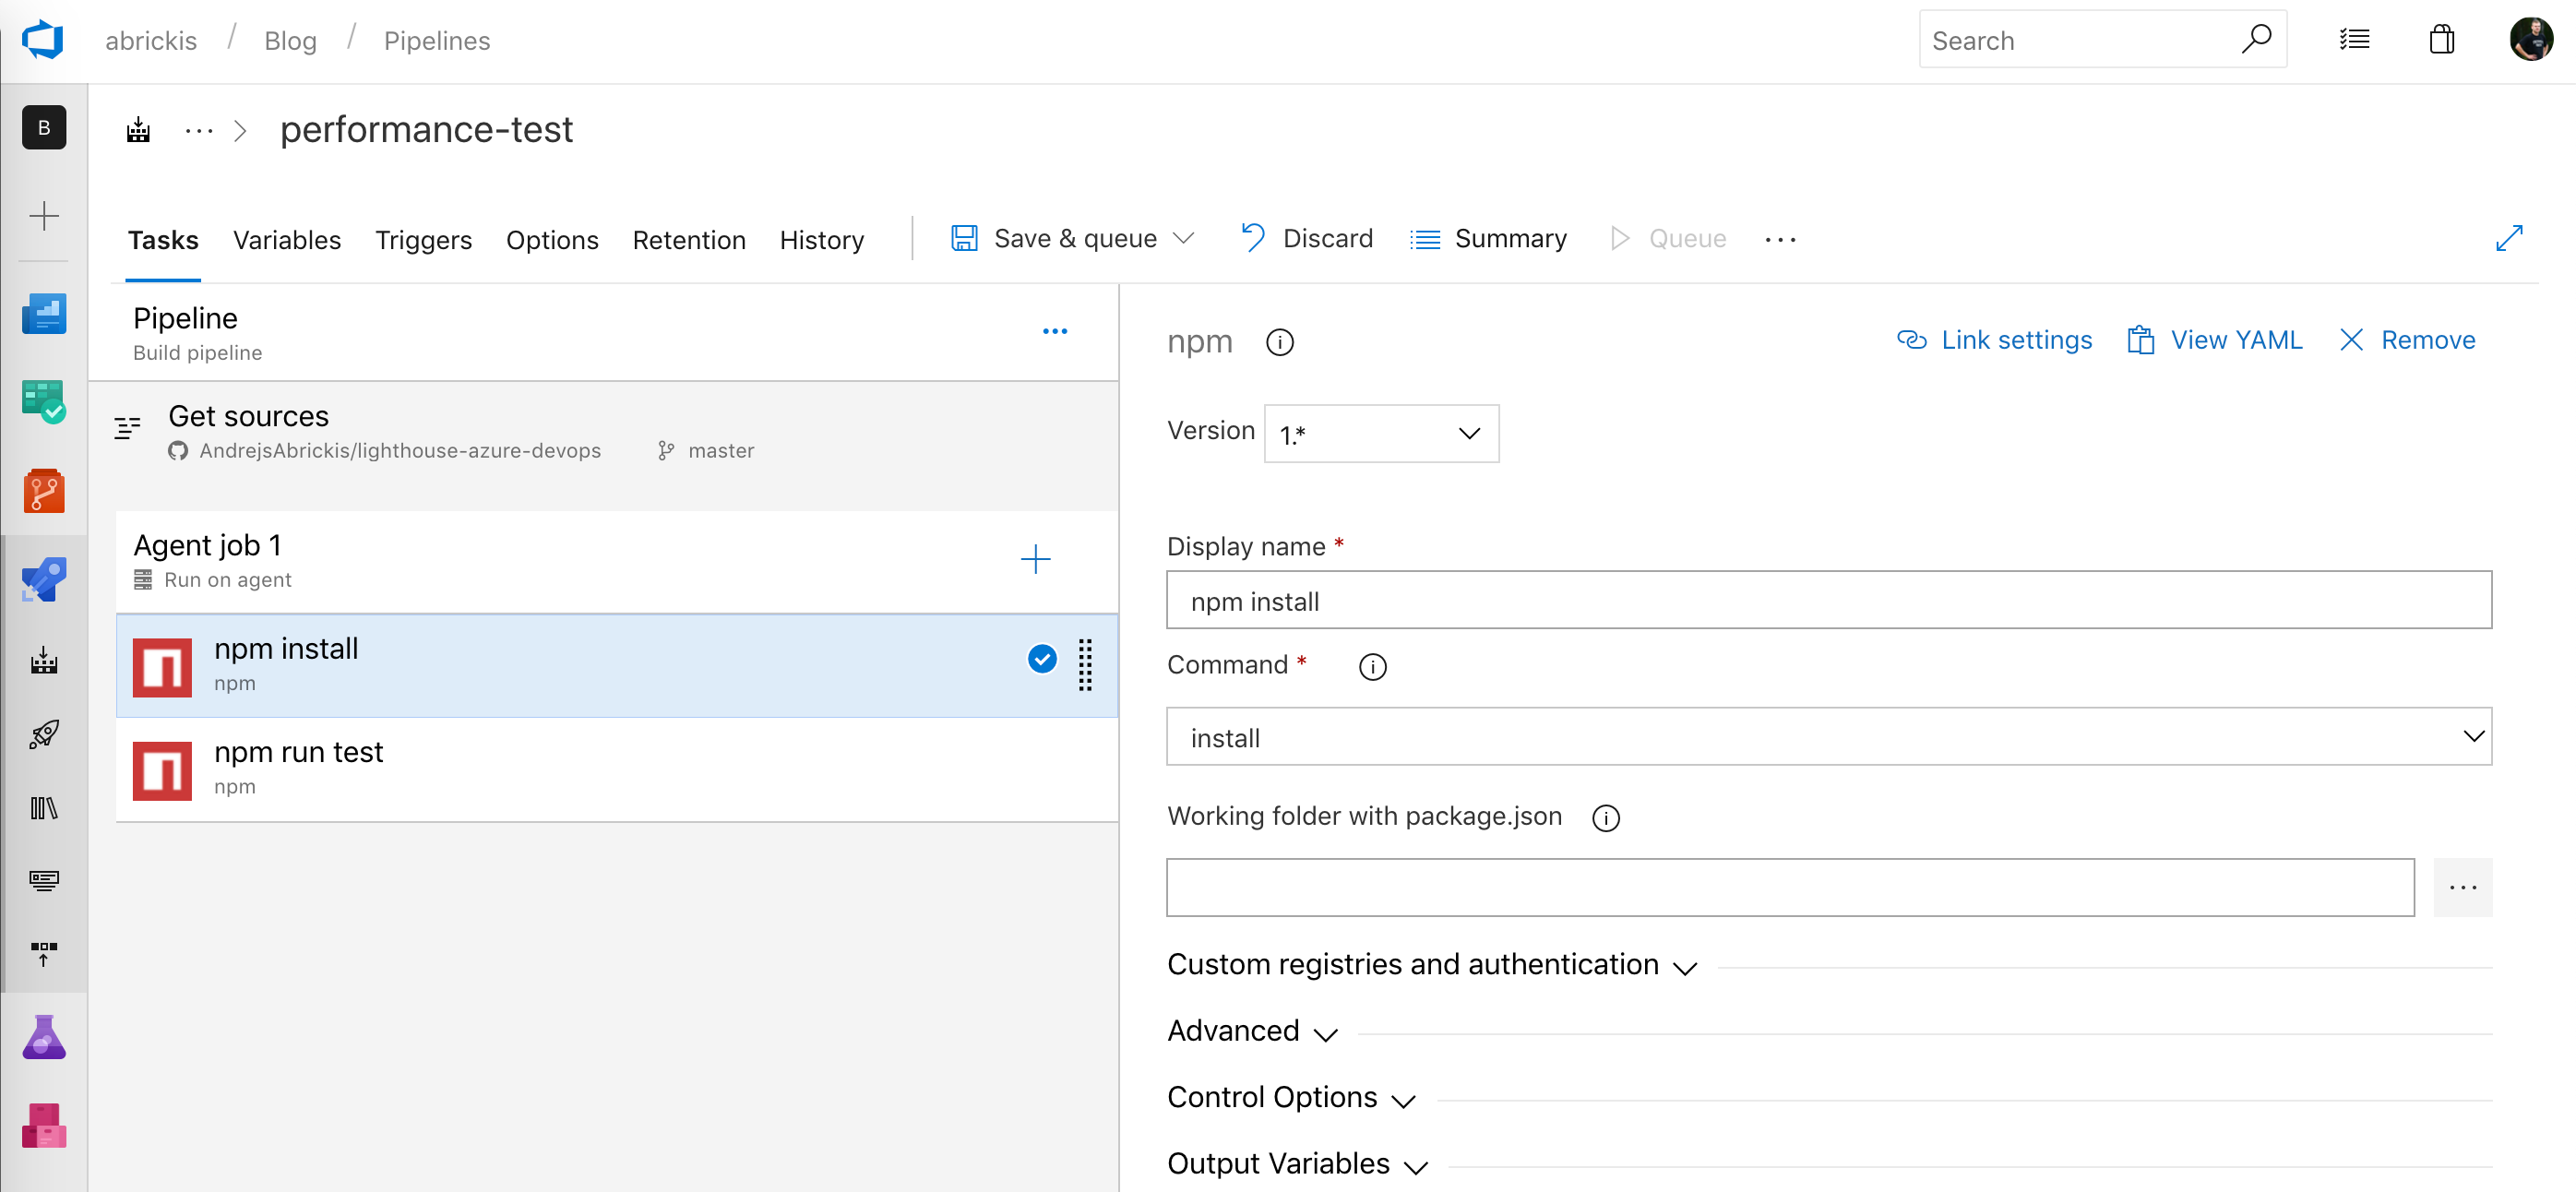
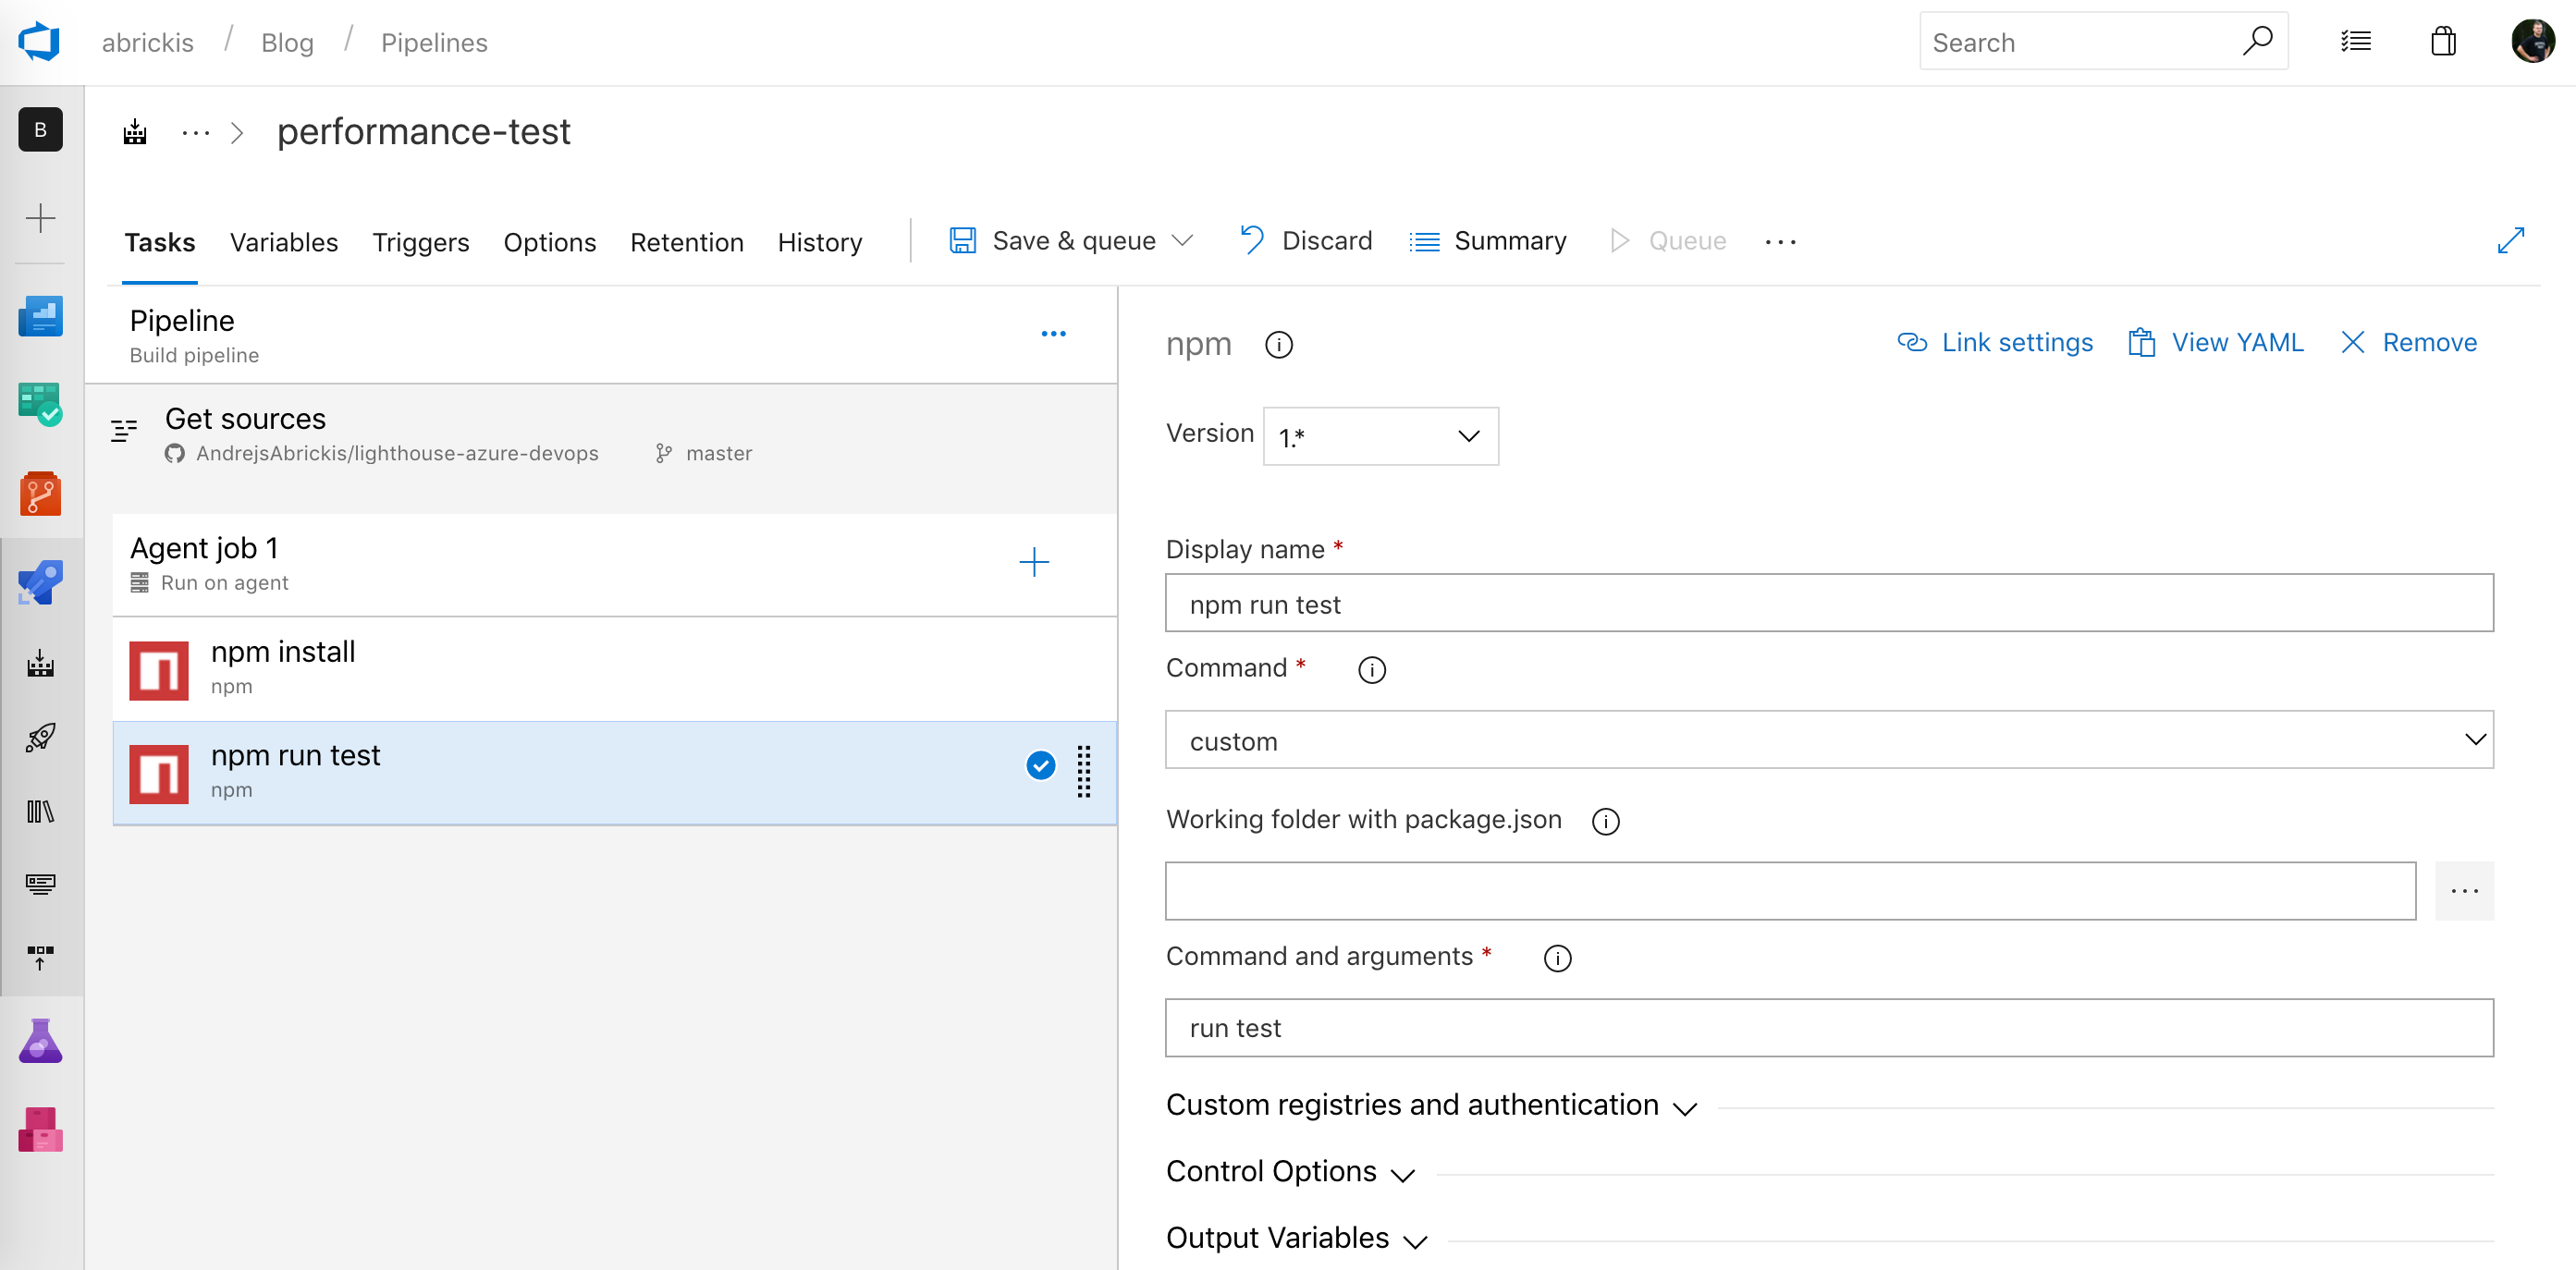
Then we will add two npm tasks to install packages and run the performance test script which is defined in package.json as a test script.
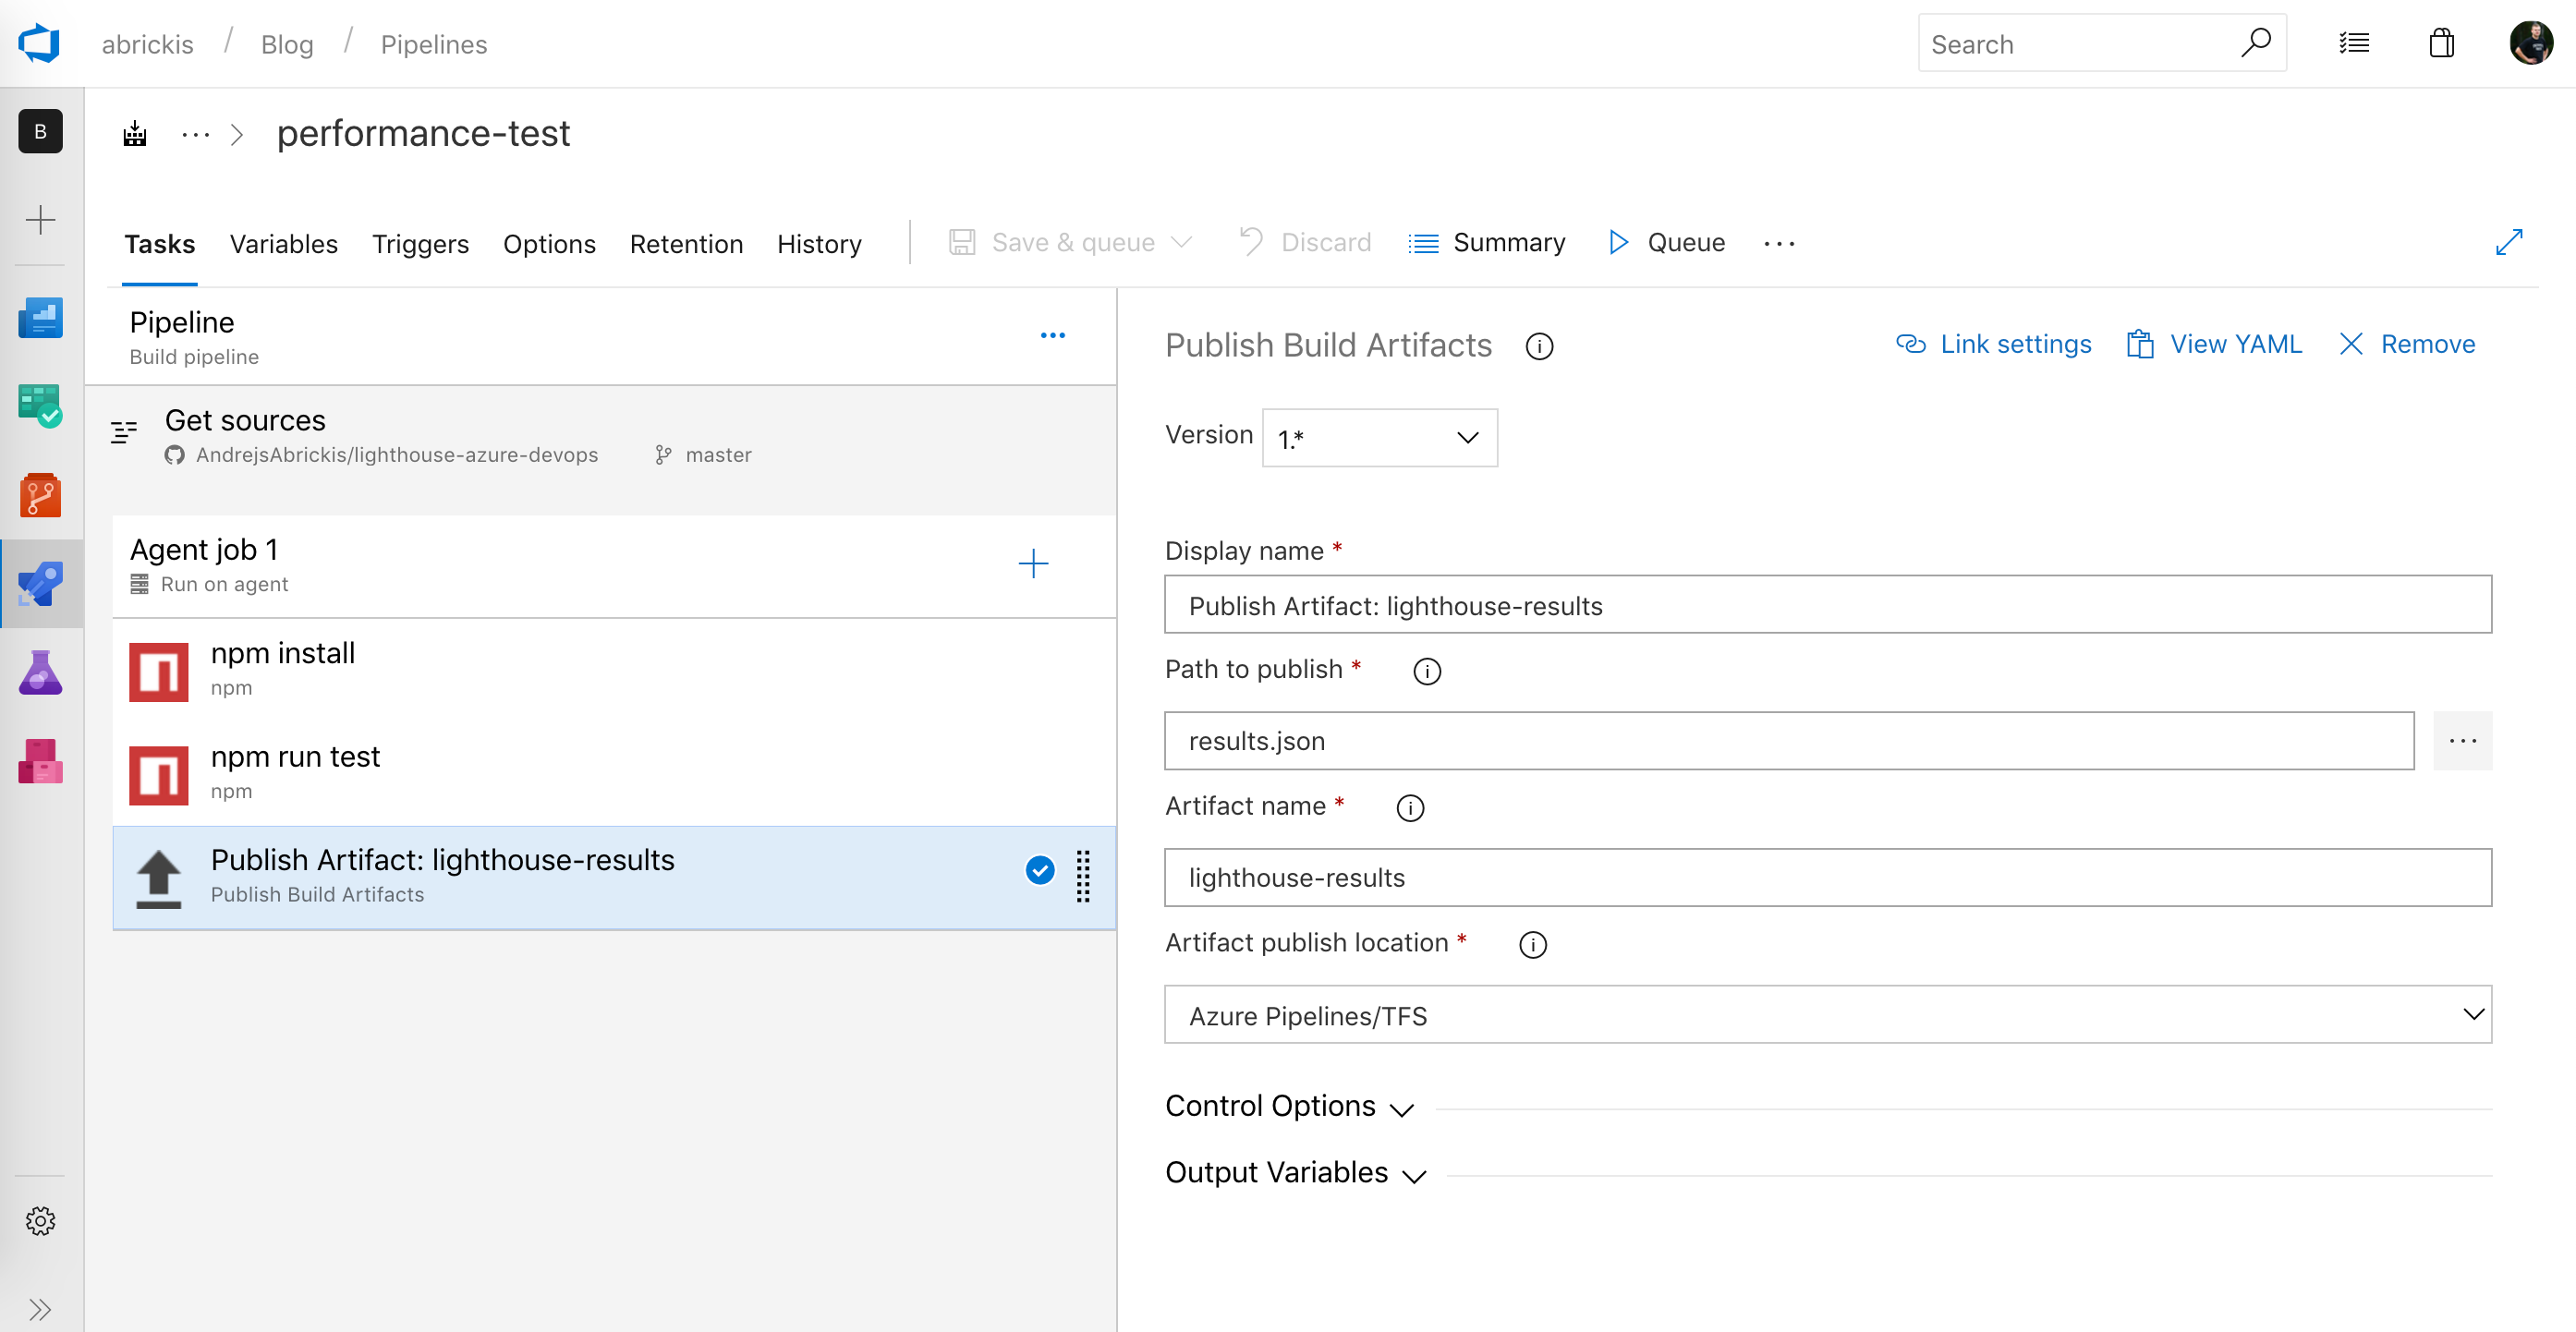
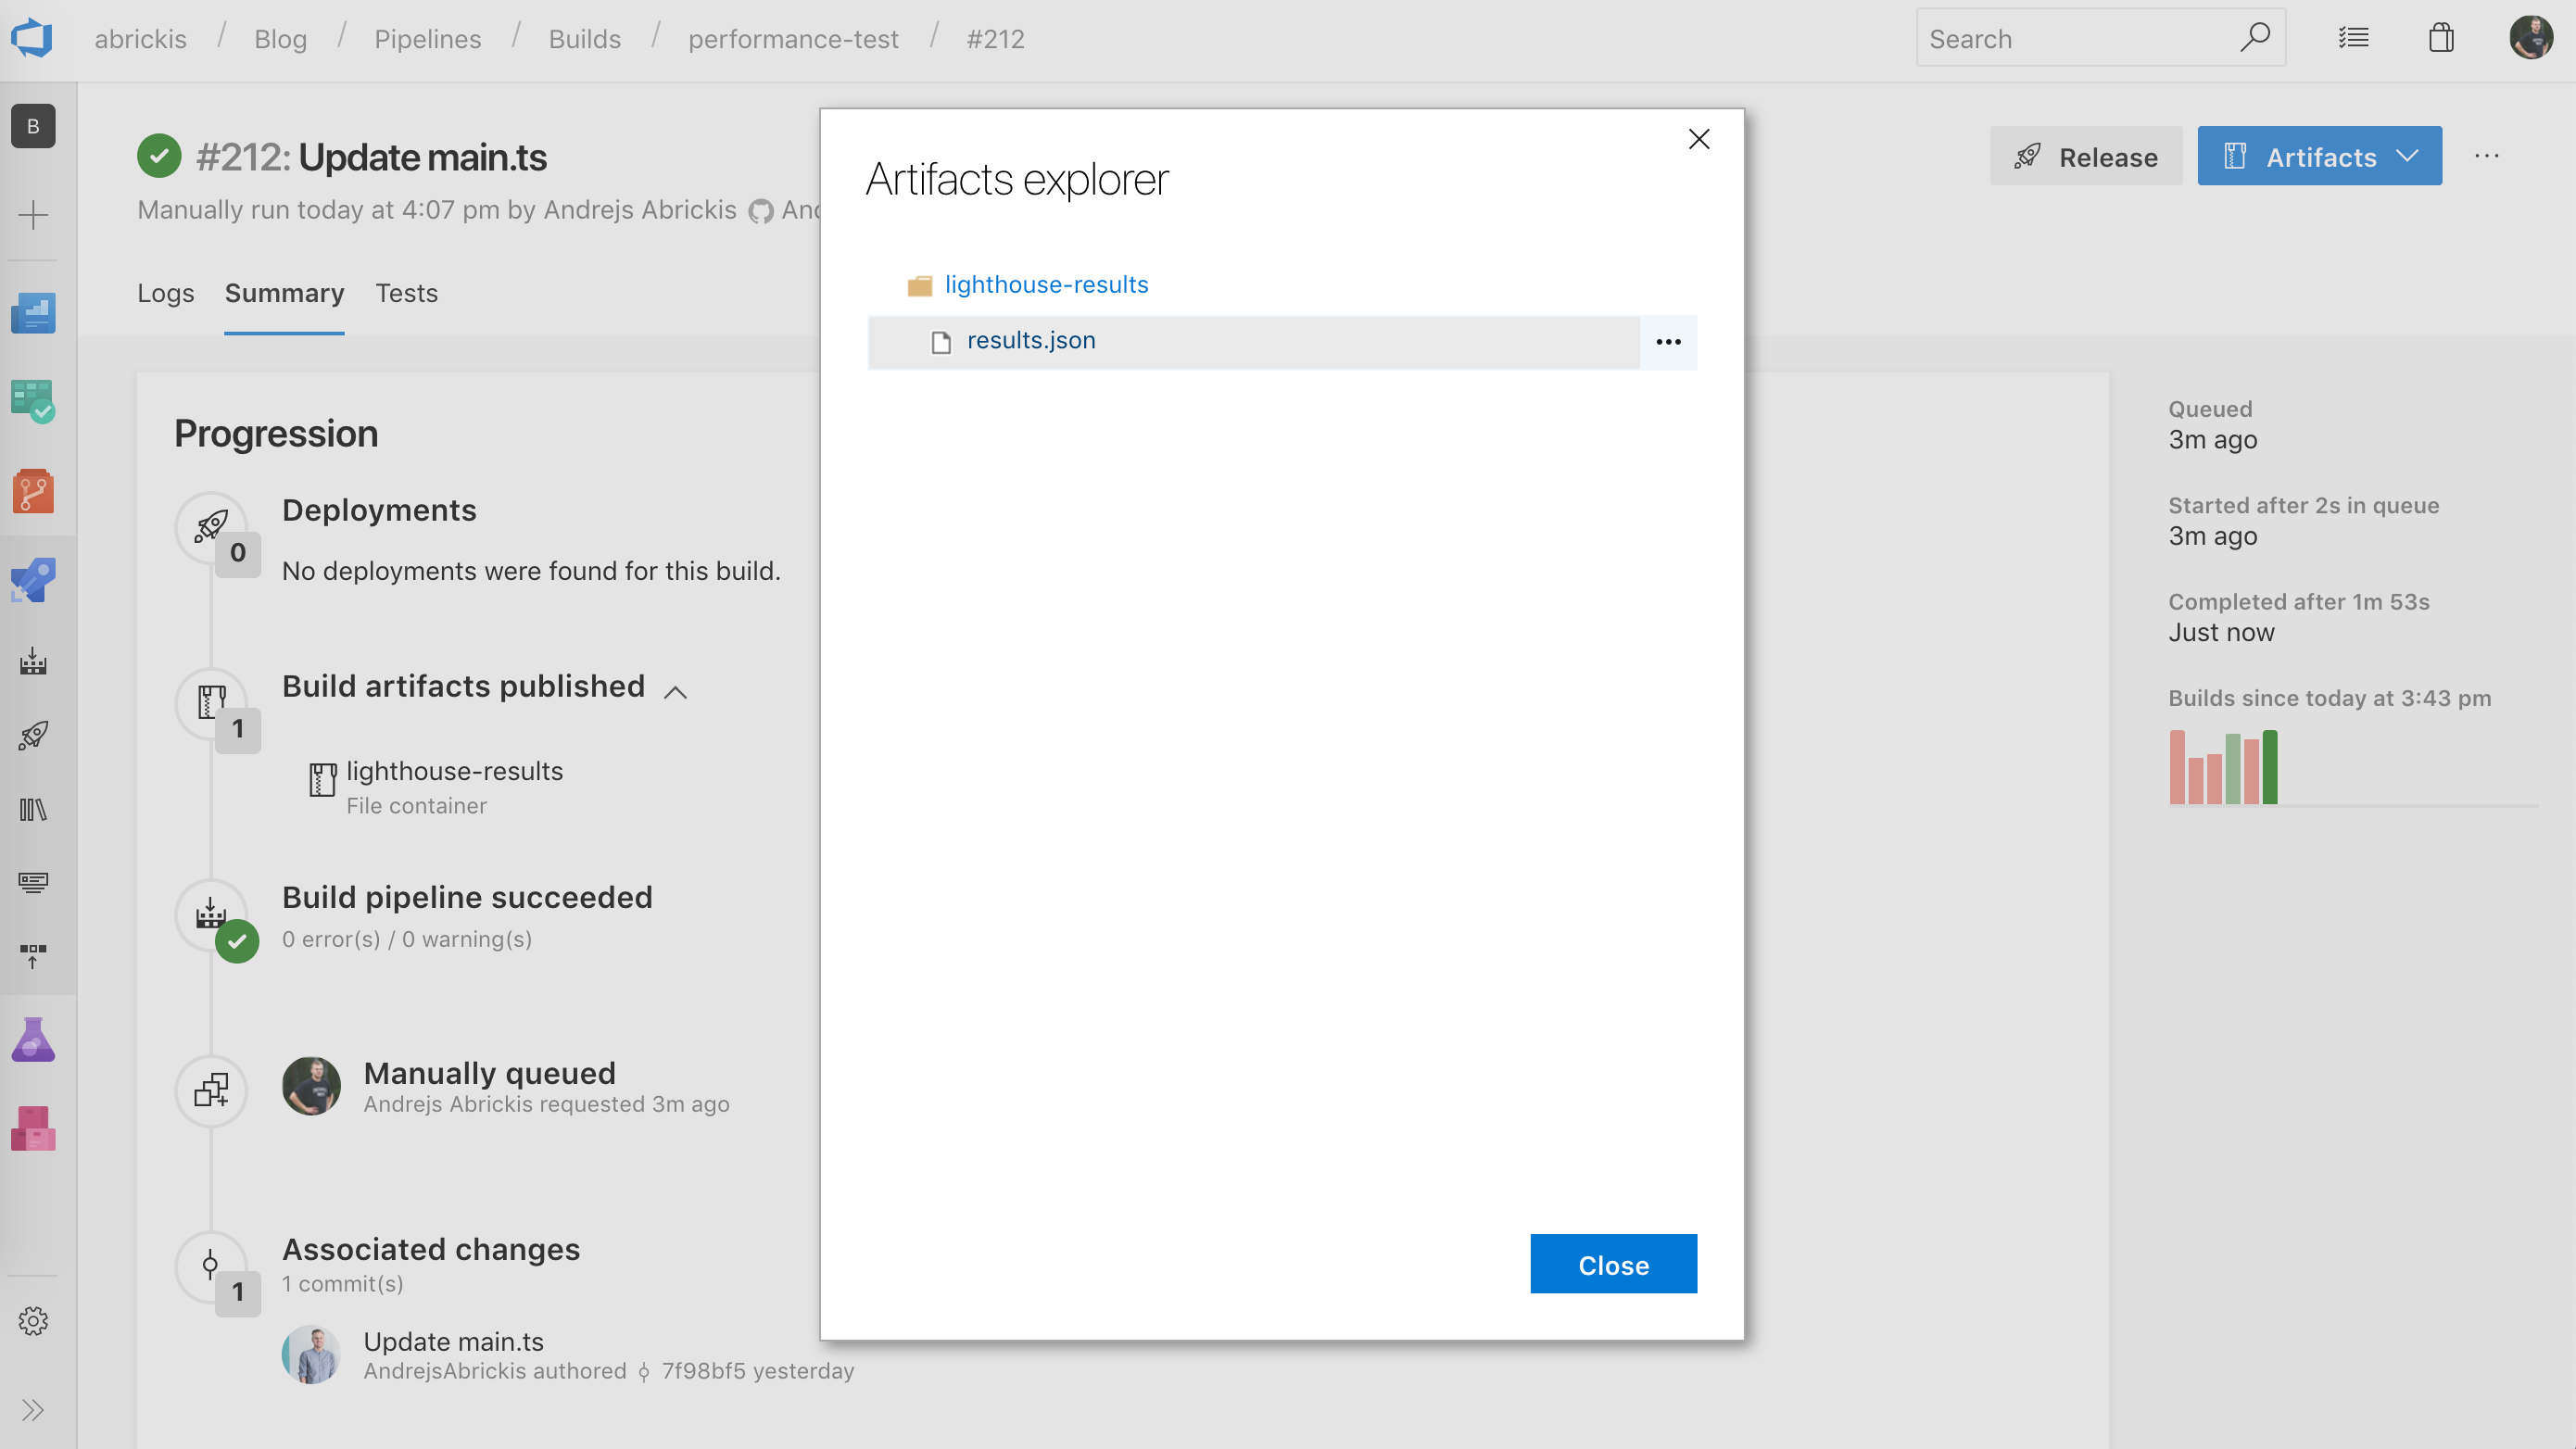
Finally, we add a task to publish build artifacts. As we are interested in the audit results we are publishing the results.json file. This artifact can be reused afterward in the next tasks of build pipeline or in a release pipeline.
After we run the build pipeline we see that the results.json is available as the build's output artifact.
In the end, we can navigate to the pipeline's trigger section and update the build pipeline and enable scheduled runs, for example, every day at 9 AM or multiple times per day.
With this simple script and Azure DevOps build pipeline, we have set up a scheduled performance test which runs Google Chrome’s lighthouse audits. We can now upload the results.json to Azure Blob Storage or AWS S3 bucket to collect and analyze performance data over time. That would allow us to see how the changes in web app’s code and configuration affect the web apps performance. And by running the test before every production release we can be sure that we are not delivering an update which could downgrade the performance for our end users.
If you found this post useful and would like to read more about random web development topics, just clap for this article or drop a comment here. And as always you can find me on Twitter@andrejsabrickis